Introduction: Why Benchmark Data Changes Everything in Google Ads
Running Google Ads without benchmark data is like driving without a speedometer, you have no idea if you are going too fast, too slow, or in the wrong direction entirely. Whether you are a digital marketing manager, a performance marketer, or a business owner spending your first rupee on Google Ads, knowing what average CPC, CPM, and CTR look like for your industry is the foundation of every good media plan.
That is exactly what the Free Google Ads Benchmark Tool by 3% Collective solves. Built on 2025 benchmark data for Display and YouTube campaigns across multiple countries including India, this tool gives you instant, contextual estimates before you spend a single rupee. This guide walks you through every feature, explains the metrics, and shows you how to use it to plan campaigns that deliver real results.
What Is the Google Ads Benchmark Tool?
The Google Ads Benchmark Tool is a free, browser-based calculator that helps advertisers plan their Google Ads campaigns using 2025 industry benchmark data. It covers two major creative formats Image/Display and Video/YouTube and lets you filter by campaign objective, industry, and country.
Here is what makes it different from a generic CPM estimator or budget planner: it applies goal-based planning adjustments on top of raw benchmark averages. This means when you select ‘Sales’ as your objective, the tool shifts the benchmark numbers to reflect how campaigns typically perform when optimised for conversions, not just awareness.
Countries Supported and Currency Display
One of the most thoughtful features of this tool is its country-aware currency support. When you select India as your country, all benchmark outputs CPC, CPM, budget forecast are displayed in Indian Rupees (₹). This removes the mental overhead of converting USD figures and makes the numbers immediately actionable for Indian campaigns.
Countries Available in the Tool
As of 2025, the tool supports the following countries:
- United States (USD)
- United Kingdom (GBP)
- Canada (CAD)
- Australia (AUD)
- India (INR)
- Singapore (SGD)
- United Arab Emirates (AED)
- Germany (EUR)
- France (EUR)
For India, the benchmark data is localised, so ₹17.95 CPC for Automotive Display campaigns reflects the actual competitive landscape of the Indian Google Ads market in 2025, not a converted USD figure. This is particularly important because India’s CPC environment is structurally different from the US market.
Understanding the Core Metrics: CPC, CPM, CTR, and VTR
CPC — Cost Per Click
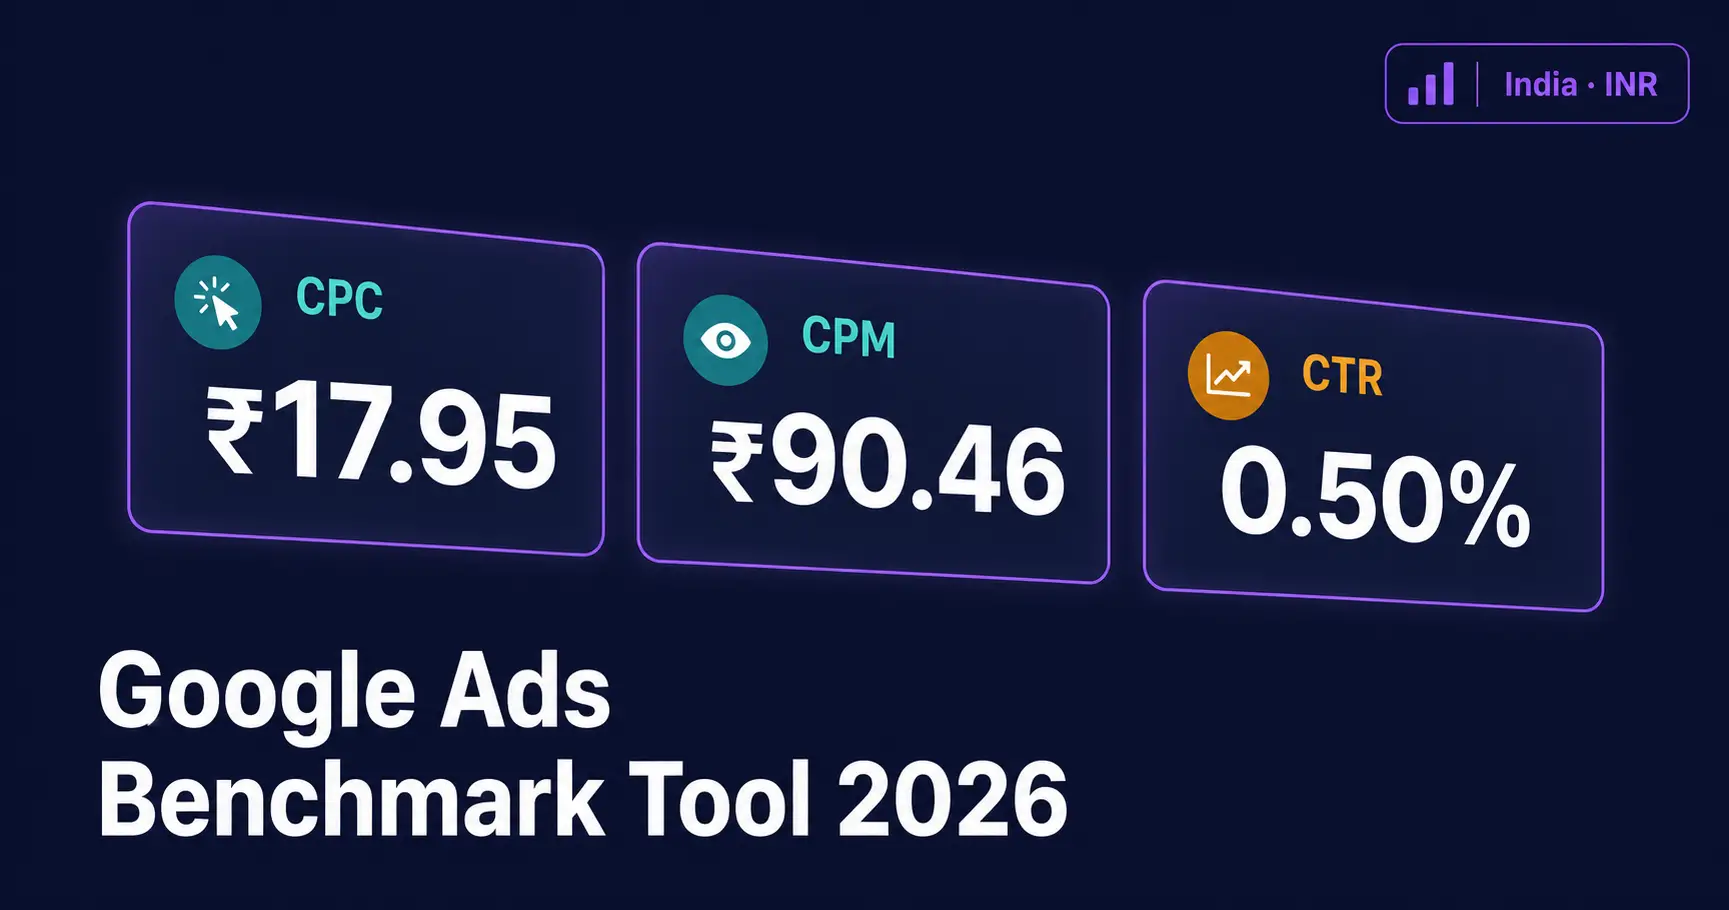
CPC (Cost Per Click) is the average amount you pay each time someone clicks on your ad. In the tool, for Automotive + Image/Display + Awareness + India, the estimated CPC is ₹17.95 which is 6.5% below the format average, meaning this industry-objective combination tends to be more cost-efficient than the average Display campaign.
CPM — Cost Per Mille (Per 1,000 Impressions)
CPM (Cost Per Mille) tells you how much it costs to reach 1,000 people with your ad. For the same Automotive + Display + India setup, the estimated CPM is ₹90.46 again below the format average, signalling that this is a comparatively efficient reach format.
CTR — Click-Through Rate
CTR (Click-Through Rate) is the percentage of people who see your ad and click it. A CTR of 0.50% for Automotive Display in India is 4.5% above the format average, which means the Automotive category drives stronger-than-average engagement on Display in India.
VTR — View-Through Rate (Video/YouTube Only)
VTR applies only to Video/YouTube campaigns and measures what percentage of viewers watch your video ad at the 30%, 50%, or full-video mark. For Automotive + Video + Awareness + India, the tool shows:
- 30% VTR: 57.3% (14.8% above average)
- 50% VTR: 46.6% (14.8% above average)
- Full VTR: 26.0% (14.8% above average)
These numbers indicate that Automotive YouTube ads in India hold viewer attention significantly better than the average campaign making video a strong format choice for this category.
The Budget Forecast: What Your Money Can Actually Buy
The Budget Forecast section is where the tool becomes genuinely useful for media planners. Enter your monthly budget say ₹1,000 and the tool calculates:
- Impressions: How many times your ad will be shown (e.g., 11,055 for Display or 12,984 for YouTube)
- Clicks: How many clicks to expect (e.g., 56 clicks on Display or 69 clicks on YouTube)
- Benchmark spend: Your actual media budget allocation
What this immediately tells you is that for the same ₹1,000 budget, Video/YouTube can deliver more impressions and more clicks than Display for the Automotive segment in India, making YouTube the more efficient format for awareness campaigns at this spend level.
This kind of side-by-side comparison, made in seconds without a spreadsheet, is the real value of the tool for anyone doing quick-turn media planning.
Objective-Adjusted Planning: Going Beyond Raw Benchmarks
What the Toggle Does
The ‘Apply objective planning adjustments’ toggle is a powerful feature that transforms raw 2025 benchmark averages into goal-specific planning estimates. When enabled, the tool applies planning multipliers based on your selected campaign objective.
The Four Campaign Objectives
The tool supports four Google Ads-aligned objectives:
- Awareness & Consideration: Broad reach focus; benchmarks skew toward CPM efficiency and high VTR
- Website Traffic: Click-volume focus; CPC becomes the primary planning metric
- Leads: Conversion-weighted; CTR is adjusted to reflect intent-based targeting
- Sales: Bottom-funnel focus; adjustments reflect purchase-intent signals
The Planner Readout section explains which adjustment mode is active and provides a plain-English interpretation for example, ‘Balanced benchmark for awareness & consideration planning. Use this as a directional benchmark, then tune with your own account history.’
Industry Benchmark Table: Comparing Across Sectors
The Benchmark Table at the bottom of the tool lets you compare CPC, CPM, and CTR across all available industries for your selected format and country. You can sort by any column and download the full data as a CSV file which is extremely useful for building media proposals or populating a planning spreadsheet.
Here is a snapshot of what the India + Video/YouTube benchmarks look like across three industries in 2025:
| Industry | CTR | CPC (₹) | CPM (₹) | Signal |
|---|---|---|---|---|
| Automotive | 0.53% | ₹14.45 | ₹77.02 | High engagement |
| Beauty & Skincare | 0.36% | ₹25.03 | ₹90.30 | Needs sharper creative |
| Education | 0.46% | ₹21.40 | ₹98.27 | Balanced benchmark |
The ‘Signal’ column is a qualitative tag that helps you quickly read the competitive environment ‘High engagement’ means this industry performs strongly vs. format averages, while ‘Needs sharper creative’ suggests that strong creative execution is essential to beat category benchmarks.
How to Use the Tool Step by Step
Here is a simple workflow for using the Google Ads Benchmark Tool effectively:
- Select your creative format: choose Image/Display for GDN campaigns or Video/YouTube for awareness and mid-funnel video strategies.
- Pick your campaign objective: this determines which planning multipliers are applied to the raw benchmarks.
- Choose your industry: the tool will highlight how your sector compares to the format-wide average.
- Select India (or your target country): this localises all metric outputs and currency display.
- Enter your monthly budget: see instant impressions, clicks, and benchmark spend forecasts.
- Download the benchmark CSV: use it in your next media plan or client proposal.
Where Does the Benchmark Data Come From?
The tool sources its 2025 benchmark data from AdBacklog’s Google Ads and YouTube Ads benchmark reports, cross-referenced with Google’s own campaign objective documentation. The objective-based adjustments are planning multipliers developed by 3% Collective based on campaign planning experience they are explicitly not raw Google-published averages, which means they are best used as directional inputs rather than guaranteed outcomes.
This is an important distinction: the tool is a planning benchmark, not a prediction engine. Your actual results will vary based on ad quality, landing page experience, bidding strategy, audience signals, and your own account history.
Limitations to Keep in Mind
- The tool uses 2025 benchmark data. Markets shift quarterly, so always supplement with your own account performance data.
- Objective adjustments are planning multipliers, not published averages treat them as directional, especially for niche industries.
- The benchmark table currently covers a limited set of industries. If your industry is not listed, use the closest proxy and adjust based on your historical CPCs.
- The tool does not factor in seasonality, bid strategy type (manual vs. smart bidding), or audience segment quality all of which significantly affect real-world performance.
10 Frequently Asked Questions About the Google Ads Benchmark Tool
Q: Is this Google Ads Benchmark Tool completely free?
A: Yes, the tool at 3percent.in is completely free to use with no sign-up or registration required. You can access all features including the CSV download at no cost.
Q: Does the tool support Indian Rupee (INR) for India campaigns?
A: Yes. When you select India as your country, all benchmark outputs including CPC, CPM, Budget Forecast, and Benchmark Spend are displayed in Indian Rupees (₹). You do not need to manually convert any figures.
Q: What is the difference between Display and YouTube benchmarks?
A: Display (Image) benchmarks apply to Google Display Network campaigns using static or animated image creatives. YouTube benchmarks apply to video-led campaigns on YouTube, which also include VTR (View-Through Rate) metrics at 30%, 50%, and full video completion levels.
Q: How accurate are the benchmark numbers?
A: The benchmarks are directional industry averages sourced from 2025 data. They are accurate as a planning starting point but should not be treated as guaranteed outcomes. Your actual CPC and CTR will depend on creative quality, audience targeting, bidding strategy, and competitive pressure in your specific market.
Q: What does the ‘Signal’ column in the Benchmark Table mean?
A: The Signal tag is a qualitative summary of how a particular industry performs relative to the format average. ‘High engagement’ means the industry outperforms average benchmarks. ‘Needs sharper creative’ suggests that creative quality is a key differentiator in that category. ‘Balanced benchmark’ means performance is close to the format average.
Q: What does ‘objective-adjusted plan’ mean in the tool?
A: When you enable the ‘Apply objective planning adjustments’ toggle, the tool applies planning multipliers to raw benchmark data based on your selected campaign goal (Awareness, Traffic, Leads, or Sales). This shifts the estimates to reflect how campaigns typically perform when optimised for a specific objective rather than showing generic averages.
Q: Can I use this tool for YouTube Shorts campaigns?
A: The Video/YouTube benchmarks can serve as a directional proxy for YouTube Shorts, but the tool is primarily benchmarked against standard YouTube ad formats (skippable in-stream, non-skippable). Shorts-specific VTR and CPM benchmarks may differ from what the tool shows.
Q: How is CPM calculated in the tool when CPC is the source?
A: For Image/Display campaigns, CTR and CPC are the source metrics, and CPM is inferred using the formula: CPM = CPC × CTR × 1000. For Video/YouTube campaigns, CTR and CPM are sourced directly and CPC is inferred. The tool clearly labels which metrics are sourced and which are inferred.
Q: Which industries are available in the tool for India?
A: As of 2026, the tool covers key Indian market segments including Automotive, Beauty & Skincare, and Education, with more industries visible in the full benchmark table. You can sort the table by CTR, CPC, or CPM and download the complete dataset as a CSV file.
Q: How should I use this benchmark data in a client proposal?
A: Use the benchmark estimates as a baseline range in your media plan. Present the CPC and CPM figures alongside the Signal tag as supporting context for your budget recommendation. Download the CSV to build a formatted benchmark table in your proposal. Always caveat that actual performance will vary and that benchmarks will be refined once campaign data is available.
Conclusion: Make Every Rupee Count with Benchmark-Led Planning
The free Google Ads Benchmark Tool by 3% Collective removes one of the biggest sources of uncertainty in digital advertising: not knowing what to expect before you spend. Whether you are planning your first Display campaign or scaling YouTube strategy for an e-commerce brand, having 2025 India-specific CPC, CPM, and CTR benchmarks at your fingertips changes the quality of every conversation with clients, with finance teams, and with your own strategic instincts.
Use it to set realistic expectations, spot high-engagement opportunities (like Automotive on YouTube in India), and build proposals grounded in data rather than guesswork. Combine it with your own account history as campaigns mature, and you will have a genuinely powerful planning loop.
FREE GOOGLE ADS BENCHMARK TOOL
Stop Guessing. Start Planning With Real 2025 Benchmark Data.
Whether you want to validate your CPC before spending, understand what your monthly budget can actually buy, or benchmark your industry’s CTR — this tool gives you the numbers instantly. No sign-up. No spreadsheet.
📍 MG Road, Bengaluru, Karnataka